Core Platform Solutions (Always included)
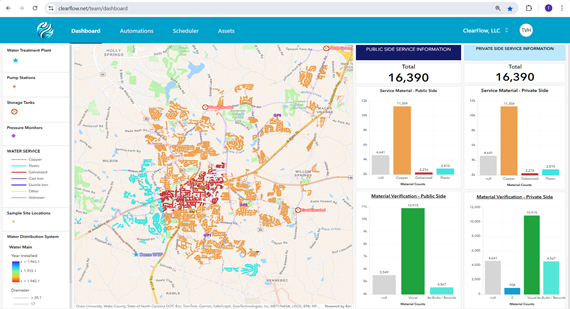
Platform Overview & Add-on Modules GIS, Operations & Workflows Ongoing Services & SupportDrinking Water Utility Solutions
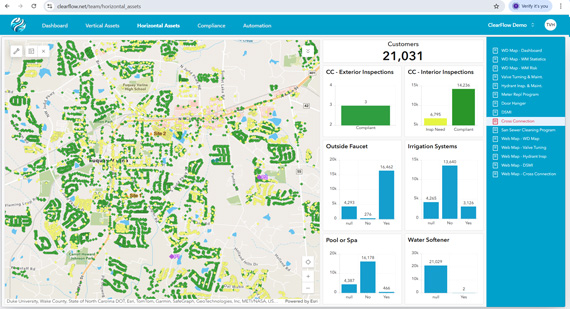
Vertical Asset Management Horizontal Asset Management Compliance & ReportingWastewater Utility Solutions
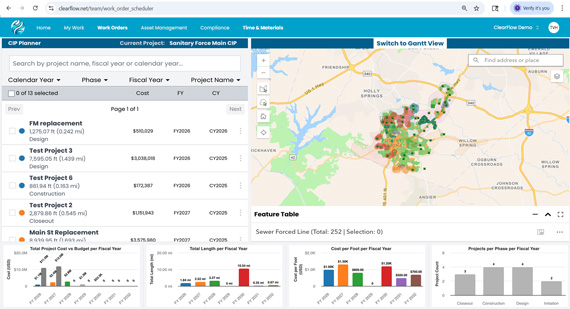
Vertical Asset Management Horizontal Asset Management Compliance & ReportingPublic Works Solutions
Vertical Asset Management Horizontal Asset Management